 BI Facilitates Predictive Modelling
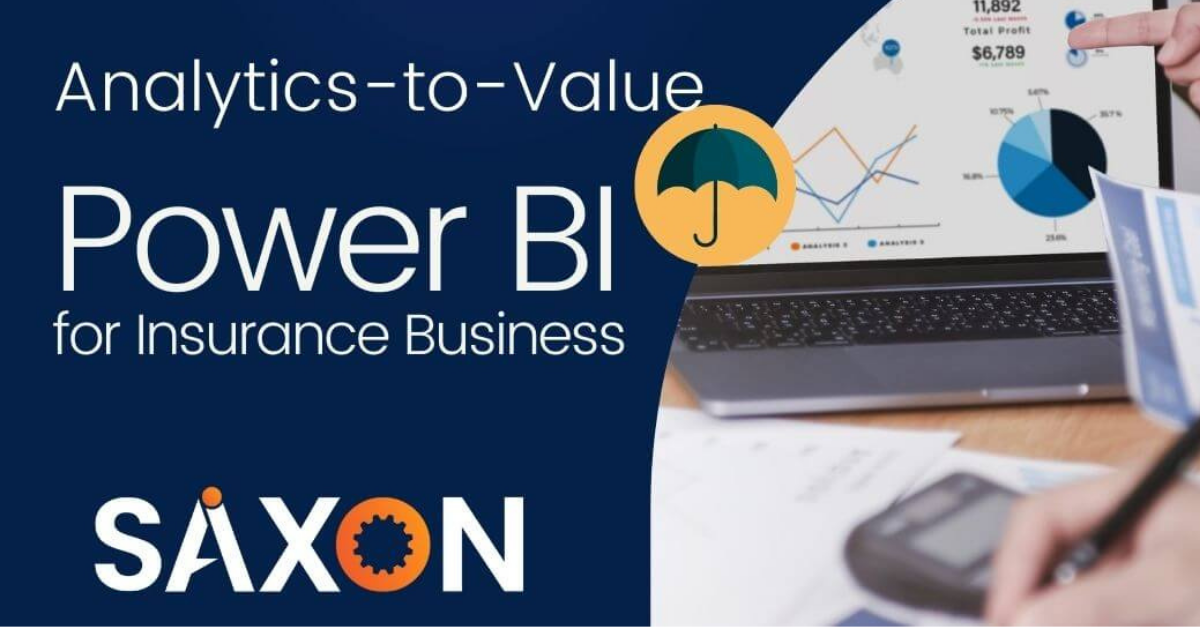
Apart from storing data and generating reports, some companies are using BI in more transformative ways. Predictive analysis is one of the most unique benefits, and it will likely become the new industry-wide standard in the next few years. Machine-learning algorithms use past insurance claims to predict customer behaviour and incidents of fraud. These predictive models are above the actuarial models currently used throughout. Insurance companies also must collect this data regularly to make the best predictions. Moreover, the data can be outdated or even inaccurate, especially if you’re basing predictions on self-reported customer surveys. Artificial intelligence (AI) and machine-learning models generate a specific predictive “score” for every claim. The more claims that an algorithm is fed, the more accurate the scores become over time. Insurance companies use this BI tool primarily for: Underwriting risk Financial projection Product profitability models Benefits of Business Intelligence in the Insurance Industry Business Intelligence has a wider adoption rate across the globe by businesses. Almost every industry and business function reaped the benefits of it and hence the same with the insurance industry. Companies that use BI service applications and tools have many advantages over those that don’t, including: Combat Fraud Build Efficiency into Claims Management Identify dark and hidden opportunities Better Enablement of Sales teams Summary: Having access to business intelligence and analytics is crucial for any insurance company craving to succeed in this highly competitive industry. The ability to turn large volumes of raw data into actionable insights showcases a significant value proposition for these businesses. These insights can be invaluable in terms of the endless opportunities they can unearth across the business. About Saxon: It all comes back to good data. We’ve got you covered for any data project across verticals. Our comprehensive business intelligence consulting services inclusive of Power BI solutions, Data Visualization, Dashboard Design & Development along with DBA support services can help. Our experts help you to discover how to unlock the true potential of the data and let you take the next step in choosing the right tool and technology for any of your data application. Read More: insurance business analytics
0 Comments
Data visualization consulting helps reveal critical data to business users via intuitive visuals. Saxon Global consultants enable data visualization for customers to spot trends, track business goal achievements, compare the performance of various categories, products, brands, etc.
Why Saxon Global Data analytics and data management services since 1989. Data warehousing and BI expertise since 2005. Big data services since 2013. Microsoft Power BI services since 2016. Partnerships with Microsoft, Amazon, Oracle, and other tech leaders. ISO 9001 and ISO 27001 certified to assure the quality of the data visualization services and the security of the customers’ data. Expertise in 30+ industries, including manufacturing, retail and wholesale, professional services, healthcare, financial services, telecommunications, energy, and others. Data Visualization Use Cases We Cover Saxon Global team can help you turn data from diverse sources into immersive visuals, which enables monitoring goals and results, identifying opportunities, predicting demand, and more. These are some of the use cases we cover: Financials Marketing and sales Manufacturing Supply chain Assets HR Data Visualization Techniques We Use Symbol map Line chart Bar chart Pie chart Heat map Funnel chart Connectivity chart Scatterplot Sparkline Matrix Pivot table |
AuthorWrite something about yourself. No need to be fancy, just an overview. ArchivesCategories |
 RSS Feed
